Auckland Walking and Cycling Counts
Our Walking and Cycling Team asked, "Can we just get a map of Auckland's walking and cycling counts? The data is too important for our projects to have to hunt down and pore over disparate tables."
"Yes, you can," said the Data Science Team, and thus was born Auckland Walking and Cycling Counts.
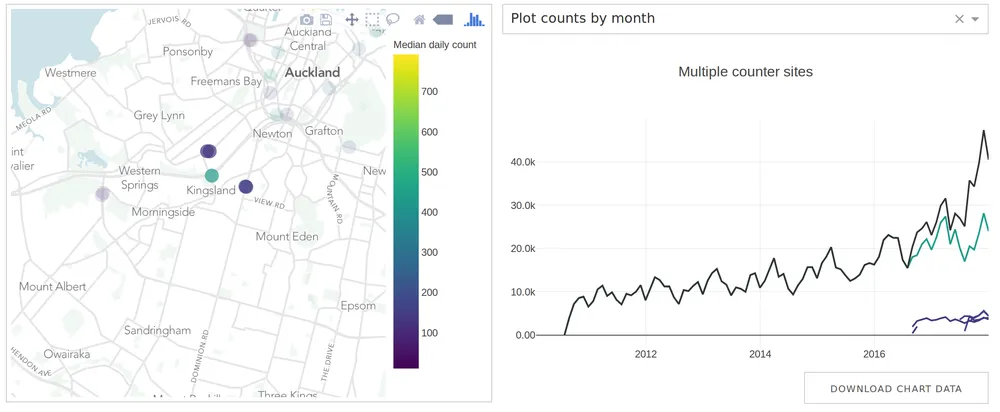
We built a data pipeline to collect walking counts from 2012 to present from Heart of the City and cycling counts from 2010 to present from EcoVisio, who also supply Auckland Transport. We then mapped the counters and resampled the counts at various frequencies (weekly, monthly, etc.) to produce interactive maps and time series charts to quickly spot trends for any subset of counter sites.
We put this all onto a simple public-facing website for us and all the other urban nerds out there to access.
"We use the cycle counter charts to track long term trends and to interrogate short term changes that might be explained by infrastructure improvements or unexpected events. Having this information at our fingertips helps us provide the best advice to our clients." ~Kent Lundberg, Principal Urban Designer at MRCagney