Transit Stops
Transit flows but it also stops, and our Public Transport Team wanted to know at what force.
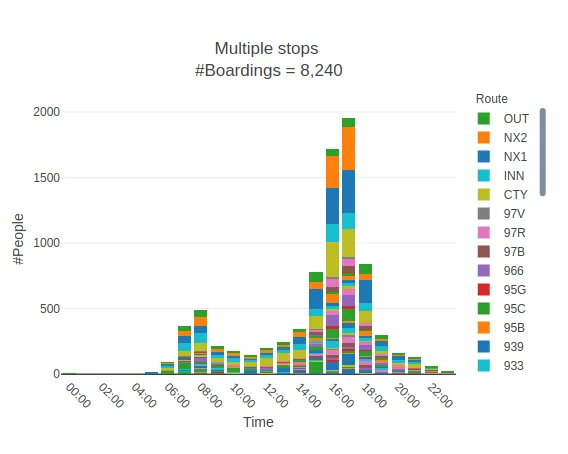
To answer those questions, we created Transit Stops, visualisation of public transport boardings and alightings. Transit Stops combines scheduling and ticketing data for a given date, and colour-codes stops according to one of the following three indicators: number of boardings, number of alightings, or the sum of the two. You can select an indicator and then quickly see the busy stops across the city. You can also select one or several stops and to get at hourly time series of passenger counts at that stop/stop group, along with a toggleable list of routes contributing to those counts.

"Remember when Google Street View came along and you no longer had to drive 30km to check if there was a utility pole where you wanted to put your bus stop? That’s what Transit Stops is like for boarding and alighting data. Game changer. It gives me an at-a-glance understanding of how people access our network from which I can quickly drill down for more details about boardings and alightings by route and time of day. With this tool I no longer have to wade through massive spreadsheets and risk error; I can just click and go." ~Lewis Thorwaldson, Senior Public Transport Planner at MRCagney
 MRCagney Works